Data Visualization in R With ggplot2
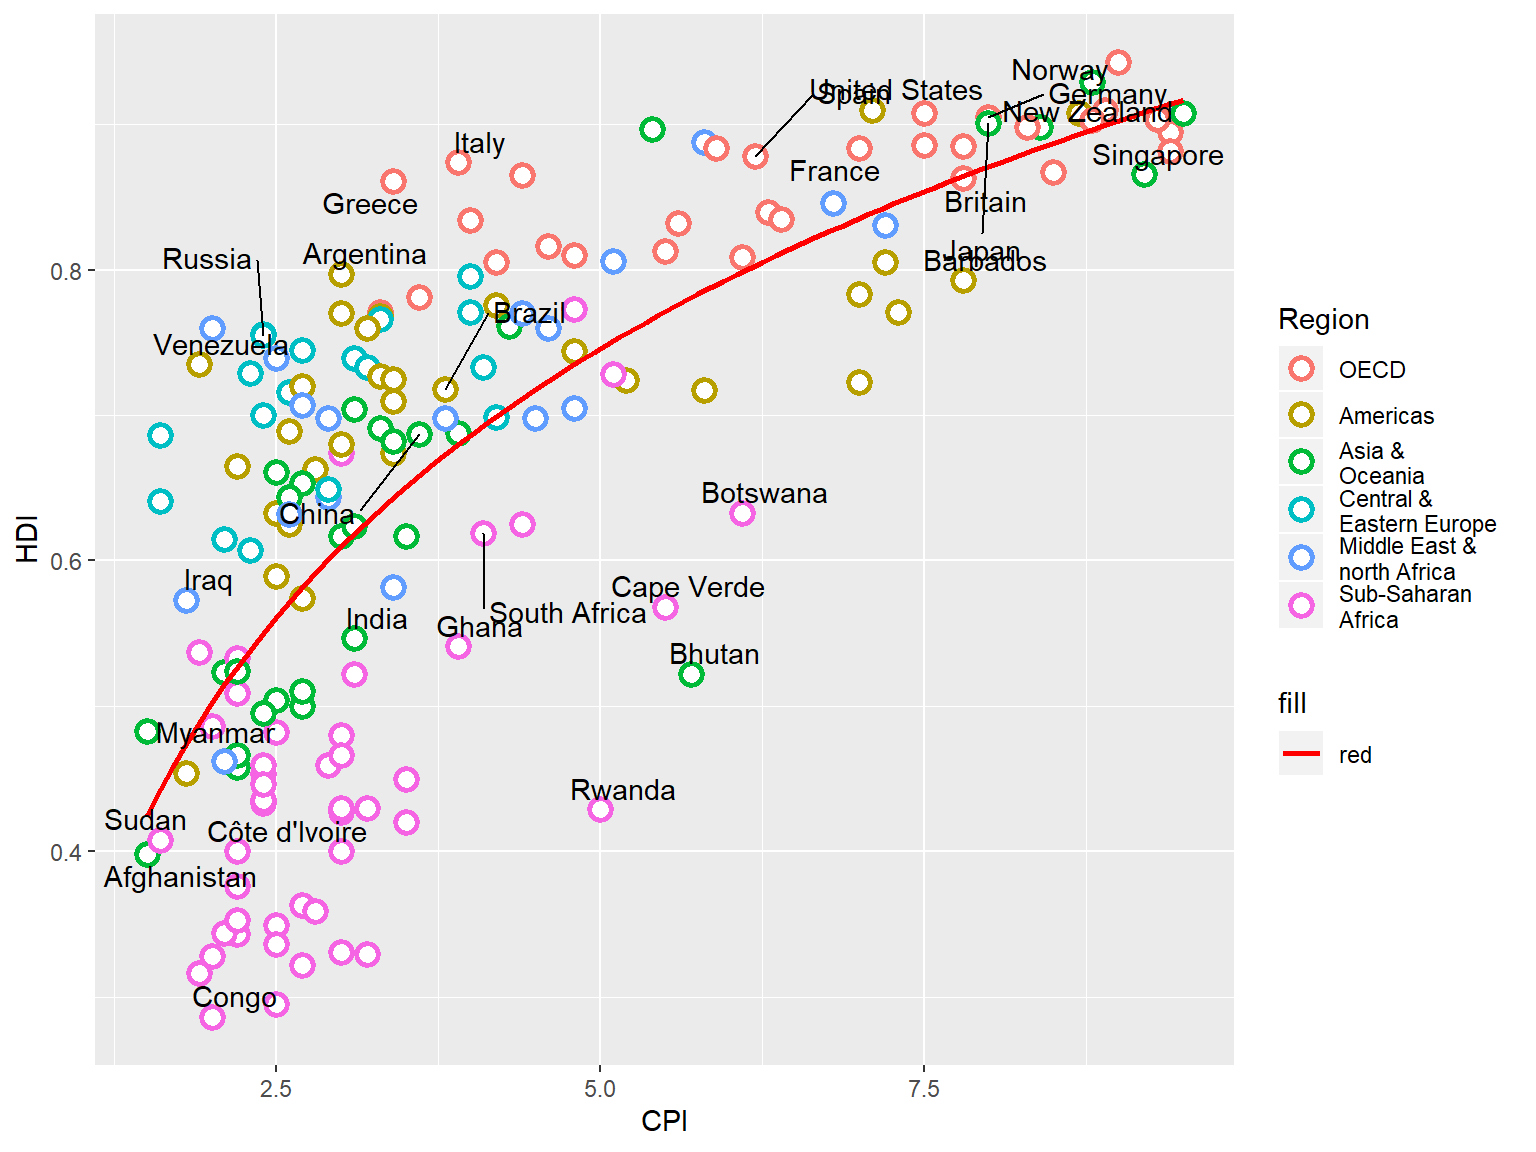 Image credit: ehoumanevans
Une présentation pour s’initier à la visualisation graphique avec R. La présentation est disponible sur Rpub. ggplot2 is a data visualization package for the statistical programming language R. which was created by Hadley Wickham in 2005.
A ce lien, vous trouverez tout ce qui est nécessaire pour vous initier à la visualisation des données avec R, sans effort, pas à pas.
Examples
Code
---
title: "Data Visualization in R With ggplot2"
author: "<br>Ehouman Evans <br> _Abidjan R users_"
date: "12.07.2019"
output:
revealjs::revealjs_presentation:
transition: slide
---
import image
<center> <img src="ggplot2.jpg" width="500"/> </center>
knitr::opts_chunk$set(echo = FALSE)
Introduction
Introduction
- ggplot2 is a data visualization package for the statistical programming language R. Created by Hadley Wickham in 2005
- ggplot2 stands for Grammar of Graphics
Agenda
- ggplot2 presenation : Install and load the package
- Basic ggplot2 graphs (Density, Bar, …)
- Case study
Packages required for the presentation
Install package
install.packages("gapminder")
install.packages("datasets")
install.packages("tidyverse")
install.packages("grid")
install.packages("ggrepel")
install.packages("ggthemes")
install.packages("extrafont")
install.packages("cowplot")
install.packages("readr")
install.packages("revealjs")
ggplot2 presenation
Installation
- To install R packages in RStudio: GUI versus R Console :
- Using the GUI: Go to the Packages tab and click Install
- Using the R Console: install.packages(“package_name”)
- Try this R Code: install.packages(“ggplot2”)
Loading an R Package For Use
- Once you’ve installed an R package, it’s then bundled with R and RStudio.
- However, to access these files you must load your R package.
- Try this R Code: library(ggplot2)
ggplot2 code
General structure
```{r, eval=FALSE, echo=TRUE, message=FALSE, warning=FALSE}
ggplot(data = <DATA>),  <GEOM_FUNCTION>(mapping = aes(<MAPPINGS>))
## ggplot2 structure exemple (1)
library(ggplot2)
ggplot(data = mpg) +
  geom_point(mapping = aes(x = displ, y = hwy))
## ggplot2 structure exemple (2)
```{r echo=TRUE, fig.width = 6, fig.height = 3, message=FALSE, warning=FALSE}
library(ggplot2)
library(gapminder)
ggplot(gapminder, aes(x = gdpPercap, y = lifeExp))
Academic supports a Markdown extension for highlighting code syntax. You can enable this feature by toggling the highlight option in your config/_default/params.toml file.
Did you find this page helpful? Consider sharing it 🙌
Ehouman Evans
Docteur en Botanique
My research interests include numerical ecology, social data collect and analysis, plant diversity and human health interaction with its environment.